It is interesting to consider the performance of fiat currencies, in terms of value and purchasing power, over time. In this section we highlight a select number of major currencies: Australia, Canada, China, Europe, Switzerland, UK and US.
In summary, major global fiat currencies have suffered as much as 99.16% loss in buying power since the modern fiat era began in 1912 and as much as 93.96% loss in buying power over the last 50 years.
Data is taken from: https://www.in2013dollars.com/
1922 to 2021: (data available beginning in 1922): Buying power of Australian Dollar decreased by 97.67%.
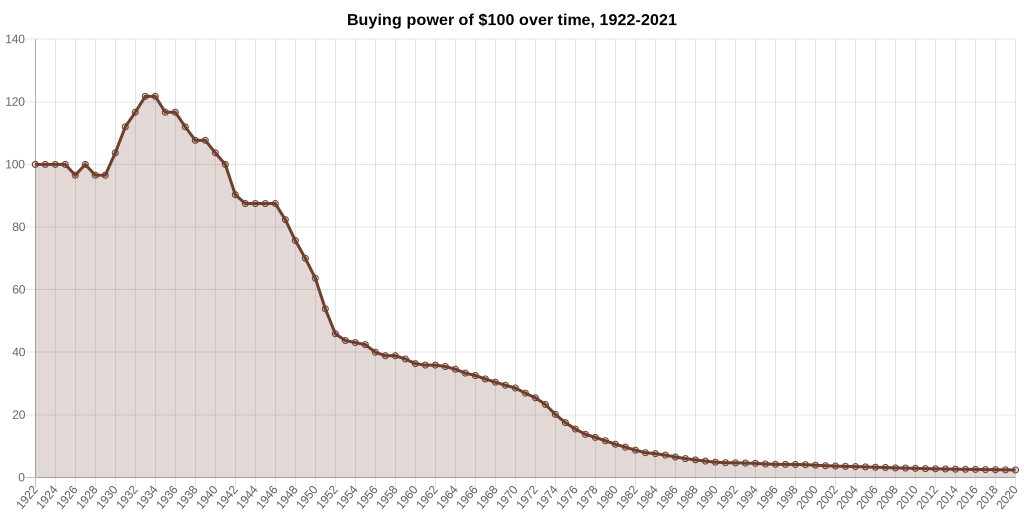
Value of $100 from 1922 to 2021
According to the Bureau of Statistics consumer price index, today’s prices in 2021 are 4,200.97% higher than average prices since 1922. The Australian dollar experienced an average inflation rate of 3.87% per year during this period, causing the real value of a dollar to decrease.
In other words, $100 in 1922 is equivalent in purchasing power to about $4,300.97 in 2021, a difference of $4,200.97 over 99 years.1
https://www.in2013dollars.com/australia/inflation/1922?amount=100
1971 to 2021: Buying power of Australian Dollar decreased by 91.37%.
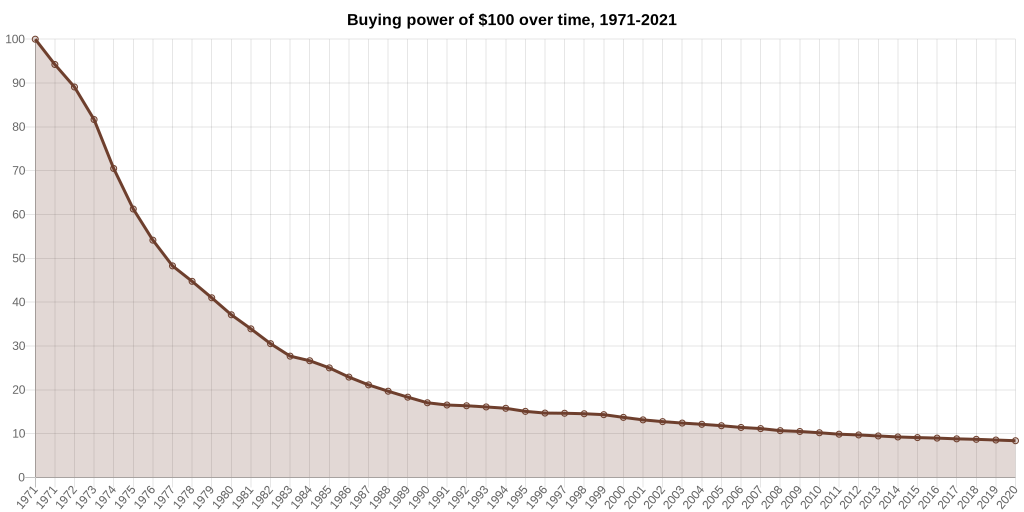
Value of $100 from 1971 to 2021
According to the Bureau of Statistics consumer price index, today’s prices in 2021 are 1,093.06% higher than average prices since 1971. The Australian dollar experienced an average inflation rate of 5.08% per year during this period, causing the real value of a dollar to decrease.
In other words, $100 in 1971 is equivalent in purchasing power to about $1,193.06 in 2021, a difference of $1,093.06 over 50 years.1
https://www.in2013dollars.com/australia/inflation/1971?endYear=2021&amount=100&future_pct=0.03
Raw data for these calculations comes from the government of Australia’s annual (CPI) as provided by the Reserve Bank of Australia . The consumer price index was established in 1922 and is tracked by Australian Bureau of Statistics (ABS).
“2021 Inflation Prediction | Future Australia Inflation Calculator.” Official Inflation Data, Alioth Finance, 8 Mar. 2021, https://www.officialdata.org/australia/inflation/1971?endYear=2021&amount=100&future_pct=0.03.
Special thanks to QuickChart for their chart image API, which is used for chart downloads.
in2013dollars.com is a reference website maintained by the Official Data Foundation.
**
1914 to 2021: (data available beginning in 1914): Buying power of Canadian Dollar decreased by 95.66%.
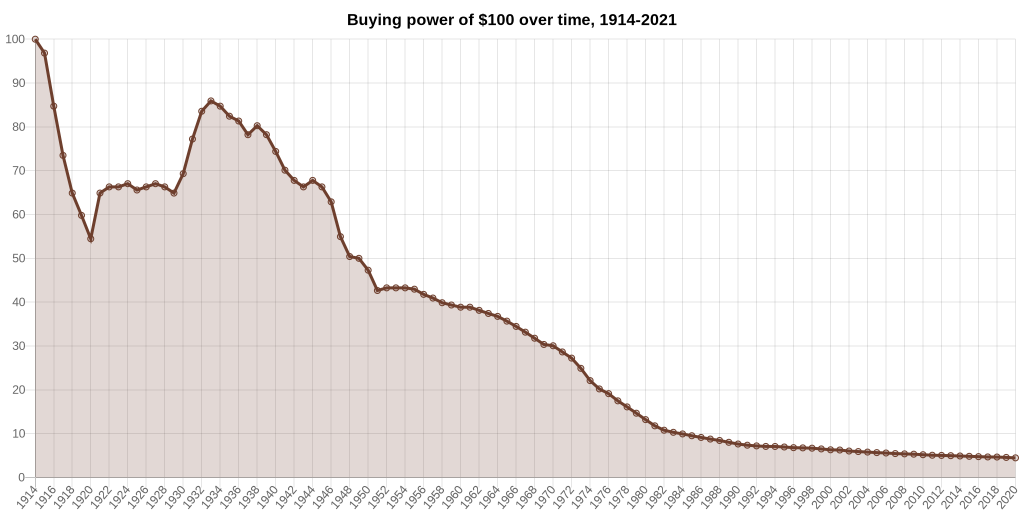
Value of $100 from 1914 to 2021
According to Statistics Canada consumer price index, today’s prices in 2021 are 2,203.15% higher than average prices since 1914. The Canadian dollar experienced an average inflation rate of 2.98% per year during this period, causing the real value of a dollar to decrease.
In other words, $100 in 1914 is equivalent in purchasing power to about $2,303.15 in 2021, a difference of $2,203.15 over 107 years.1
https://www.in2013dollars.com/canada/inflation/1914?endYear=2021&amount=100&future_pct=0.03
1971 to 2021: Buying power of the Canadian Dollar decreased by 84.80%.
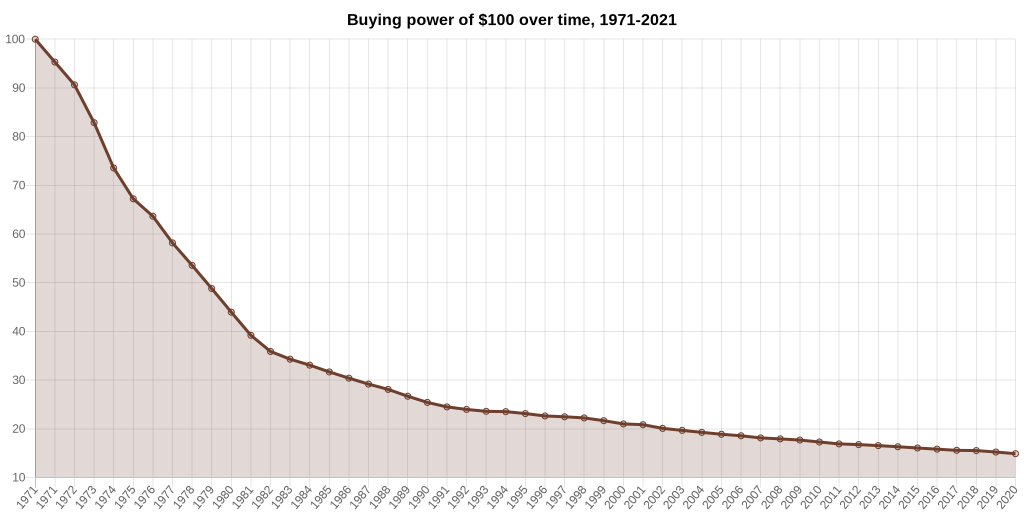
Value of $100 from 1971 to 2021
According to Statistics Canada consumer price index, today’s prices in 2021 are 559.59% higher than average prices since 1971. The Canadian dollar experienced an average inflation rate of 3.84% per year during this period, causing the real value of a dollar to decrease.
In other words, $100 in 1971 is equivalent in purchasing power to about $659.59 in 2021, a difference of $559.59 over 50 years.1
https://www.in2013dollars.com/canada/inflation/1971?endYear=2021&amount=100&future_pct=0.03
Raw data for these calculations comes from the government of Canada’s annual Consumer Price Index (CPI), established in 1914 and computed by Statistics Canada (StatCan).
“2021 Inflation Prediction | Future Canada Inflation Calculator.” Official Inflation Data, Alioth Finance, 8 Mar. 2021, https://www.officialdata.org/canada/inflation/1971?endYear=2021&amount=100&future_pct=0.03.
Special thanks to QuickChart for their chart image API, which is used for chart downloads.
in2013dollars.com is a reference website maintained by the Official Data Foundation.
**
1986 to 2021: (price index tracking began in 1986): Buying power of the Chinese Renminbi decreased by 80.33%.
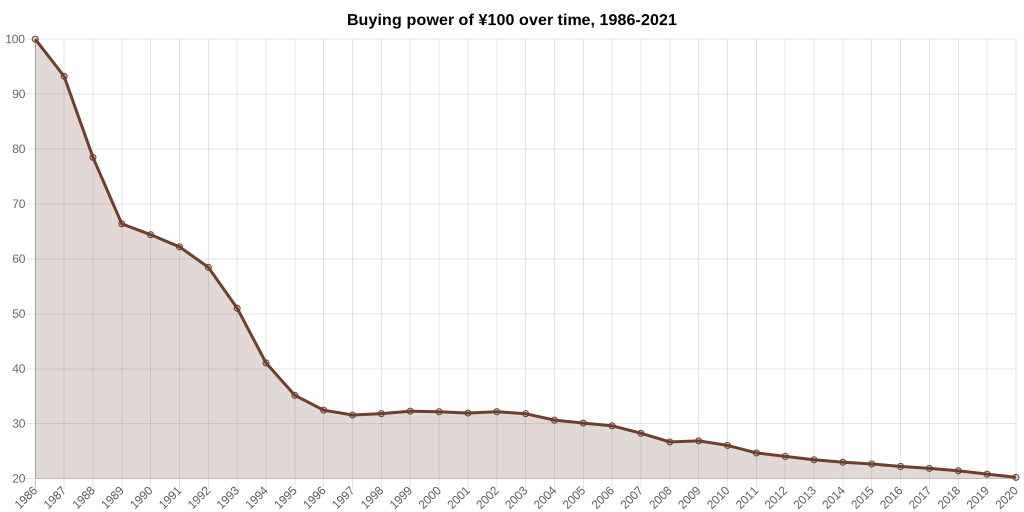
Value of ¥100 from 1986 to 2021
According to the World Bank consumer price index for China, today’s prices in 2021 are 408.44% higher than average prices since 1986. The Chinese Renminbi experienced an average inflation rate of 4.76% per year during this period, causing the real value of a renminbi to decrease.
In other words, ¥100 in 1986 is equivalent in purchasing power to about ¥508.44 in 2021, a difference of ¥408.44 over 35 years. This inflation data is collected by the World Bank and is specific to China.1
https://www.in2013dollars.com/china/inflation/1986?amount=100
“¥100 in 1986 → 2021 | China Inflation Calculator.” Official Inflation Data, Alioth Finance, 15 Mar. 2021, https://www.officialdata.org/china/inflation/1986?amount=100.
Special thanks to QuickChart for their chart image API, which is used for chart downloads.
in2013dollars.com is a reference website maintained by the Official Data Foundation.
**
1999 to 2021: (January 1, 1999 is when the Euro was first adopted): Buying power of the Euro decreased by 31.85%.
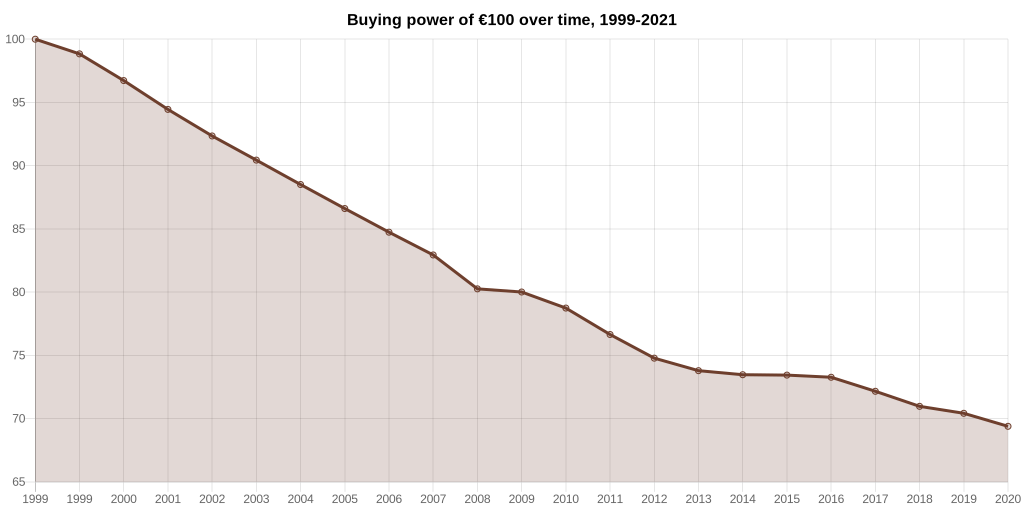
Value of €100 from 1999 to 2021
According to the European Central Bank consumer price index, today’s prices in 2021 are 46.73% higher than average prices since 1999. The Euro experienced an average inflation rate of 1.76% per year during this period, causing the real value of a euro to decrease.
In other words, €100 in 1999 is equivalent in purchasing power to about €146.73 in 2020, a difference of €46.73 over 22 years.1
https://www.in2013dollars.com/europe/inflation/1999?endYear=2021&amount=100&future_pct=0.03
Raw data for these calculations comes from the European Commission and the European Central Bank ‘s Harmonized Index of Consumer prices (HICP), which is computed based on the reported consumer price indices in member countries of the European Union.
“2021 Inflation Prediction | Future Euro Inflation Calculator.” Official Inflation Data, Alioth Finance, 15 Mar. 2021, https://www.officialdata.org/europe/inflation/1999?endYear=2021&amount=100&future_pct=0.03.
Special thanks to QuickChart for their chart image API, which is used for chart downloads.
in2013dollars.com is a reference website maintained by the Official Data Foundation.
**
1971 to 2021: ( data available beginning in 1960): Buying power of the Swiss franc decreased by 64.50%.
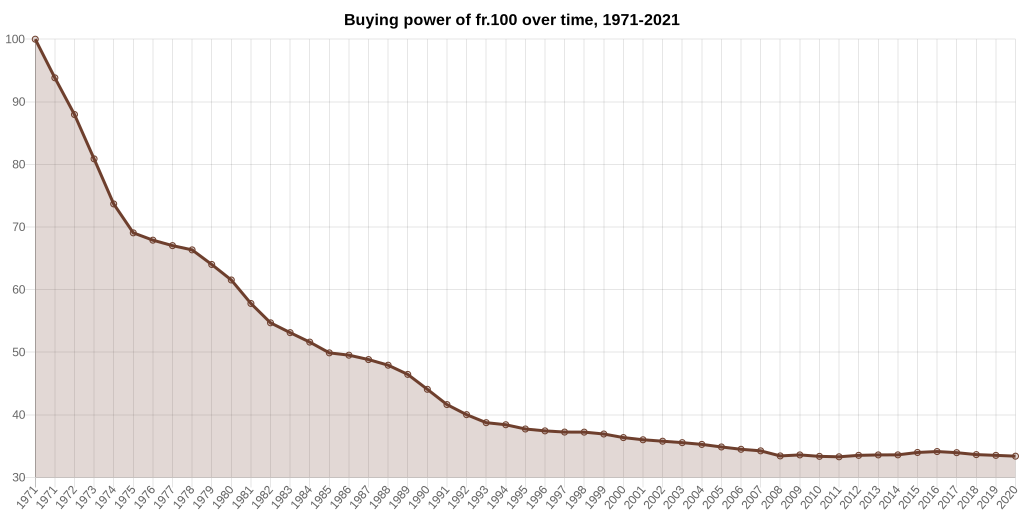
Value of fr.100 from 1971 to 2021
According to the World Bank consumer price index for Switzerland, today’s prices in 2021 are 181.92% higher than average prices since 1971. The Swiss Franc experienced an average inflation rate of 2.09% per year during this period, causing the real value of a franc to decrease.
In other words, fr.100 in 1971 is equivalent in purchasing power to about fr.281.92 in 2021, a difference of fr.181.92 over 50 years. This inflation data is collected by the World Bank and is specific to Switzerland.1
https://www.in2013dollars.com/switzerland/inflation/1971?amount=100
“fr.100 in 1971 → 2021 | Switzerland Inflation Calculator.” Official Inflation Data, Alioth Finance, 17 Mar. 2021, https://www.officialdata.org/switzerland/inflation/1971?amount=100.
Special thanks to QuickChart for their chart image API, which is used for chart downloads.
in2013dollars.com is a reference website maintained by the Official Data Foundation.
**
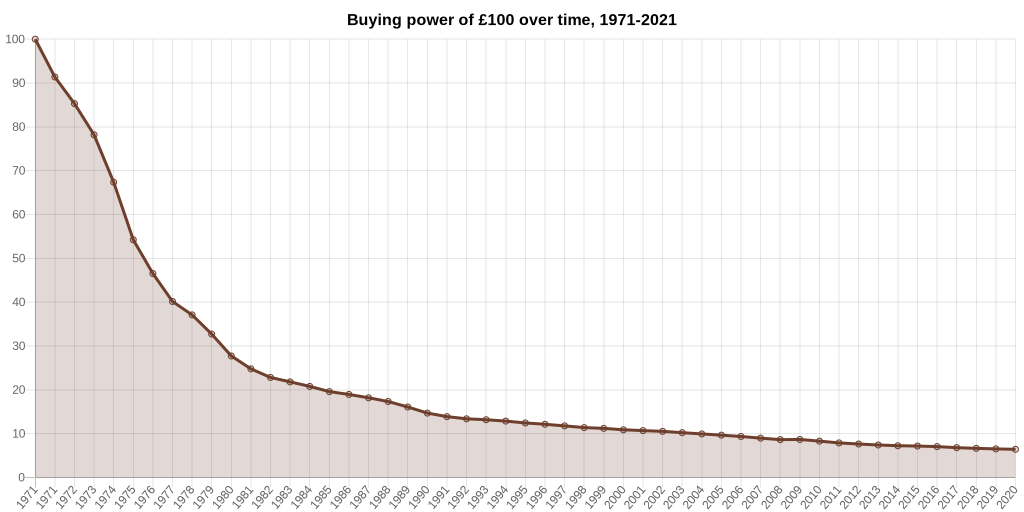
1912 to 2021: Buying power of the Pound sterling decreased by 99.16%.
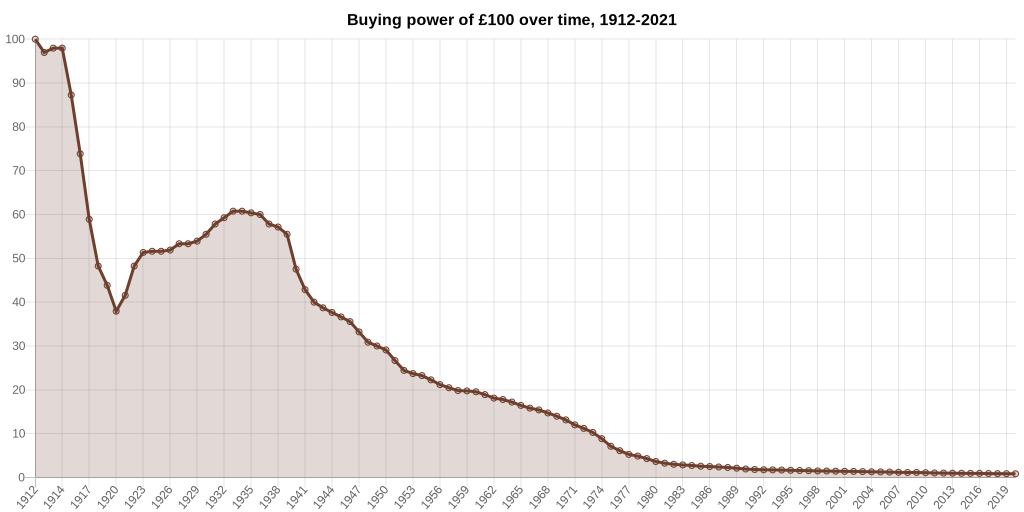
Value of £100 from 1912 to 2021
According to the Office for National Statistics composite price index, today’s prices in 2021 are 11,742.33% higher than average prices since 1912. The British pound experienced an average inflation rate of 4.48% per year during this period, causing the real value of a pound to decrease.
In other words, £100 in 1912 is equivalent in purchasing power to about £11,842.33 in 2021, a difference of £11,742.33 over 109 years.1
https://www.in2013dollars.com/uk/inflation/1912?endYear=2021&amount=100&future_pct=0.03
1971 to 2021: Buying power of the Pound sterling decreased by 93.20%.
Value of £100 from 1971 to 2021
According to the Office for National Statistics composite price index, today’s prices in 2021 are 1,365.49% higher than average prices since 1971. The British pound experienced an average inflation rate of 5.52% per year during this period, causing the real value of a pound to decrease.
In other words, £100 in 1971 is equivalent in purchasing power to about £1,465.49 in 2021, a difference of £1,365.49 over 50 years.1
https://www.in2013dollars.com/uk/inflation/1971?endYear=2021&amount=100&future_pct=0.03
Raw data for these calculations comes from the composite price index published by the UK Office for National Statistics (ONS). A composite index is created by combining price data from several different published sources, both official and unofficial. The Consumer Price Index, normally used to compute inflation, has only been tracked since 1988. All inflation calculations after 1988 use the Office for National Statistics’ Consumer Price Index, except for 2017, which is based on The Bank of England’s forecast.
“2021 Inflation Prediction | Future UK Inflation Calculator.” Official Inflation Data, Alioth Finance, 17 Mar. 2021, https://www.officialdata.org/uk/inflation/1971?endYear=2021&amount=100&future_pct=0.03.
Special thanks to QuickChart for their chart image API, which is used for chart downloads.
in2013dollars.com is a reference website maintained by the Official Data Foundation.
**
1912 to 2021: Buying power of the US Dollar decreased by 96.31%.
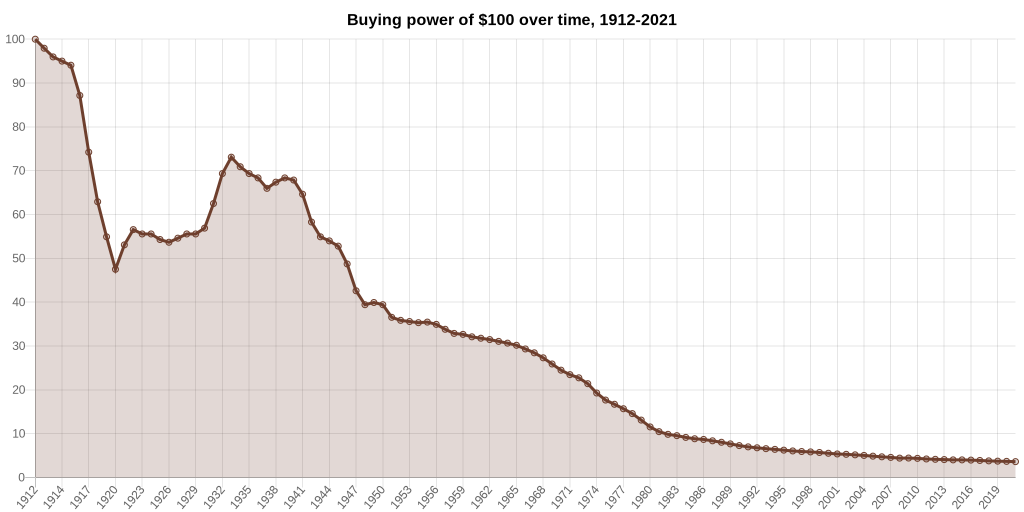
According to the Bureau of Labor Statistics consumer price index, today’s prices in 2021 are 2,611.48% higher than average prices since 1912. The U.S. dollar experienced an average inflation rate of 3.07% per year during this period, causing the real value of a dollar to decrease.
In other words, $100 in 1912 is equivalent in purchasing power to about $2,711.48 in 2021, a difference of $2,611.48 over 109 years.
The 1912 inflation rate was 2.11%. The current year-over-year inflation rate (2020 to 2021) is now 1.68%.1
https://www.in2013dollars.com/us/inflation/1912?amount=1
1971 to 2021: Buying power of the US Dollar decreased by 84.60%.
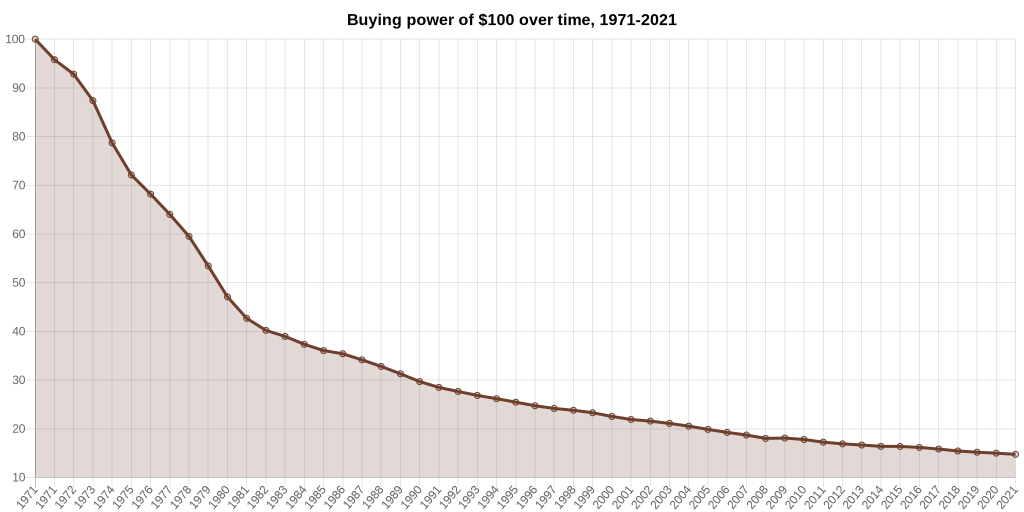
Value of $100 from 1971 to 2021
According to the Bureau of Labor Statistics consumer price index, today’s prices in 2021 are 549.42% higher than average prices since 1971. The U.S. dollar experienced an average inflation rate of 3.81% per year during this period, causing the real value of a dollar to decrease.
In other words, $100 in 1971 is equivalent in purchasing power to about $649.42 in 2021, a difference of $549.42 over 50 years.1
https://www.in2013dollars.com/us/inflation/1971?amount=100
Raw data for these calculations comes from the Bureau of Labor Statistics’ Consumer Price Index (CPI), established in 1913. Inflation data from 1665 to 1912 is sourced from a historical study conducted by political science professor Robert Sahr at Oregon State University.
“$100 in 1971 → 2021 | Inflation Calculator.” Official Inflation Data, Alioth Finance, 12 Mar. 2021, https://www.officialdata.org/us/inflation/1971?amount=100.
Special thanks to QuickChart for their chart image API, which is used for chart downloads.
in2013dollars.com is a reference website maintained by the Official Data Foundation.
**
A range of luxury asset classes, including Diamonds, Gold, Fine Art and Fine Wine, appear to hold, and increase value over time, playing an essential part in maintaining a healthy risk-balanced wealth portfolio. This section explores data that shows how they are holding or growing value over time. We will add other luxury asset classes as appropriate and relevant.
https://ajediam.com/historical-diamond-prices
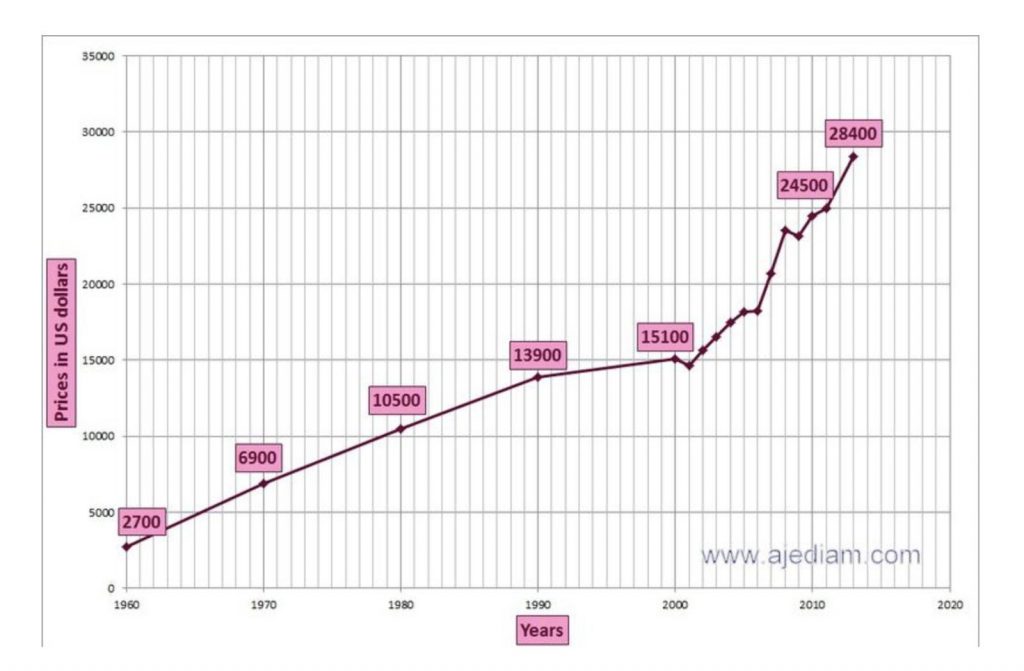
Compare Historical diamond trade price trend evolution and performance graph statistic. View changes from 1960 to 2019 in data chart, diagram
Graph statistics: compare and analyze the performance development of over 58 years changes
- Index data tracking the historical diamond prices changes up to actual prices.
- Diamond prices increases about 14% each year since 1960.
- 2018 Price for an extremely rare 1.00 Carat EX EX EX, H&A, Super Ideal Cut, Flawless, Girdle thickness medium Fluorescence none.
- Yearly increase of diamond prices and value +14.47% from 1960 to 2019 or equal to yearly compound interest of 4.3%.
**
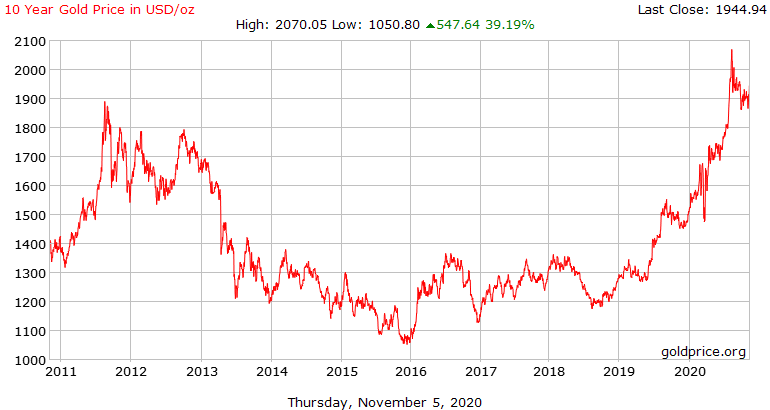
https://goldprice.org/gold-price-history.html
https://seekingalpha.com/article/4339978-since-inception-euro-devalued-85-against-gold
Gold vs the Euro
The gold price in euros has increased by 555% since the euro was created in 1999. Put differently, since inception, the euro lost 85% of its value against gold.
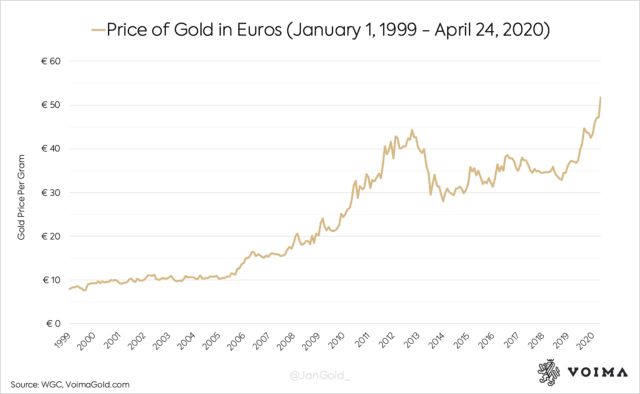
What truly matters for a currency is its purchasing power.
The gold price can be volatile, at times, but over longer periods of time, it preserves its purchasing power, with the benefit that it doesn’t have any counterparty risk, so it withstands every crisis.
**
Fine Art:
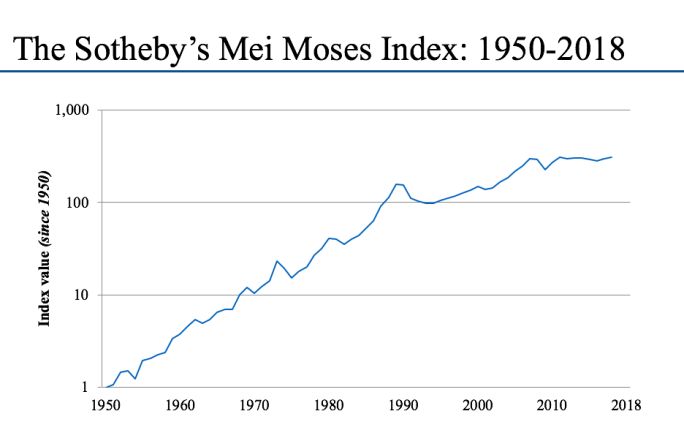
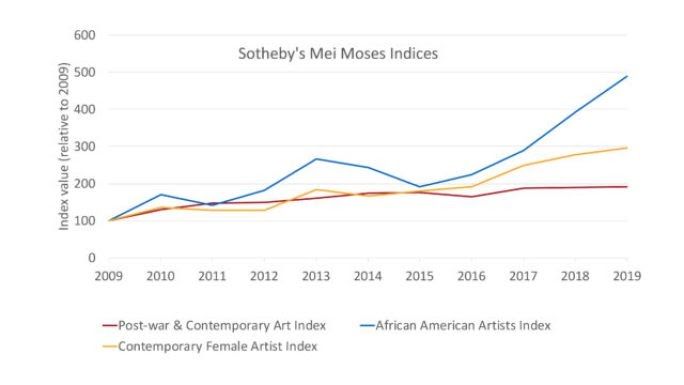
The Mei Moses® World All Art Index, which is calculated annually and based on resale values of paintings sold multiple times at auction, shows positive returns over the last 50 years, albeit mixed relative to other asset classes.
https://www.jpmorgan.com/jpmpdf/1320620625096.pdf
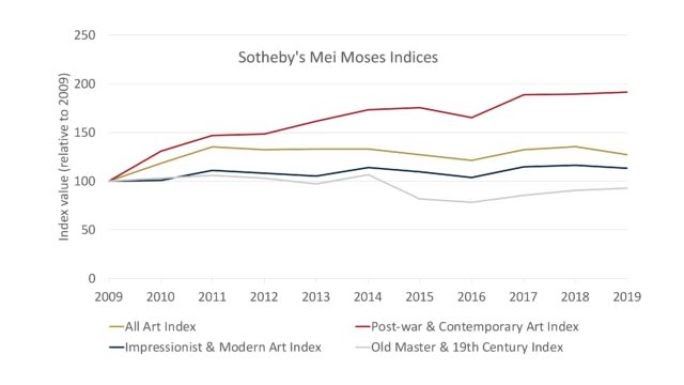
What are the Sotheby’s Mei Moses Indices?
Sotheby’s Mei Moses uses the purchase prices of the same painting at two distinct moments in time (i.e., repeat-sales) to measure the change in the value of unique works of art. Based on approximately 60,000 repeat sales from 1810-present, Sotheby’s Mei Moses Indices can be used to compare the performance of art subcategories, identify trends and internal dynamics of the market and understand the market’s relationship to broader economic and societal factors. The methodology is based on the Case-Shiller Real Estate Index.
Thinner supply at the top
More works of art were sold in 2019 than the previous year, but they collectively sold for less because there were fewer works offered and sold at the higher end. In total, a staggering 40.5 million works were sold in 2019, a 1.8% increase from 2018, according to the recent Art Basel and UBS Global Art Market Report 2020. The overall value of works sold was $64.1bn, which represented a 5.2% decline from 2018—though it remained 2.4% ahead of the $62.4bn annual average from 2010-2019.
Diversity dividend
One of the most notable developments in the art market in recent years has been the increasing demand for art created by artists who had been historically overlooked, especially female artists and African American artists.
Prices for works by female artists reappearing at auction have grown far more rapidly than those for works by men, as we documented in In Other Words last year in the edition “The Market for Female Artists—Where do They Outperform Men?”. We found that in the half-century before 2012 prices for art by men and women increased in value roughly in tandem. But between 2012 and 2018 work by female artists rose in value by an average of 72.9%, while art by male artists rose in value by only 8.3%. Possible explanations include changing preferences, market recontextualizations, the dwindling supply of “superstar” lots, and the fact that the pool of female artists is smaller, so the stats look different.
https://www.sothebys.com/en/the-sothebys-mei-moses-indices
**
Information below is from:
https://www.wineinvestment.com/docs/CW_Guide_Web_English.pdf
Investment-Grade Wines
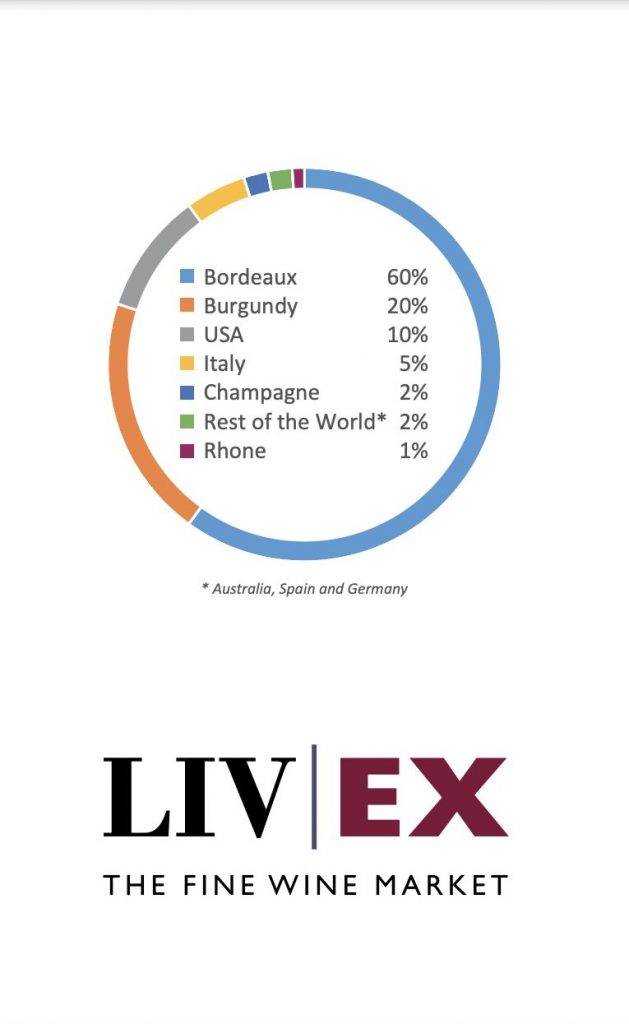
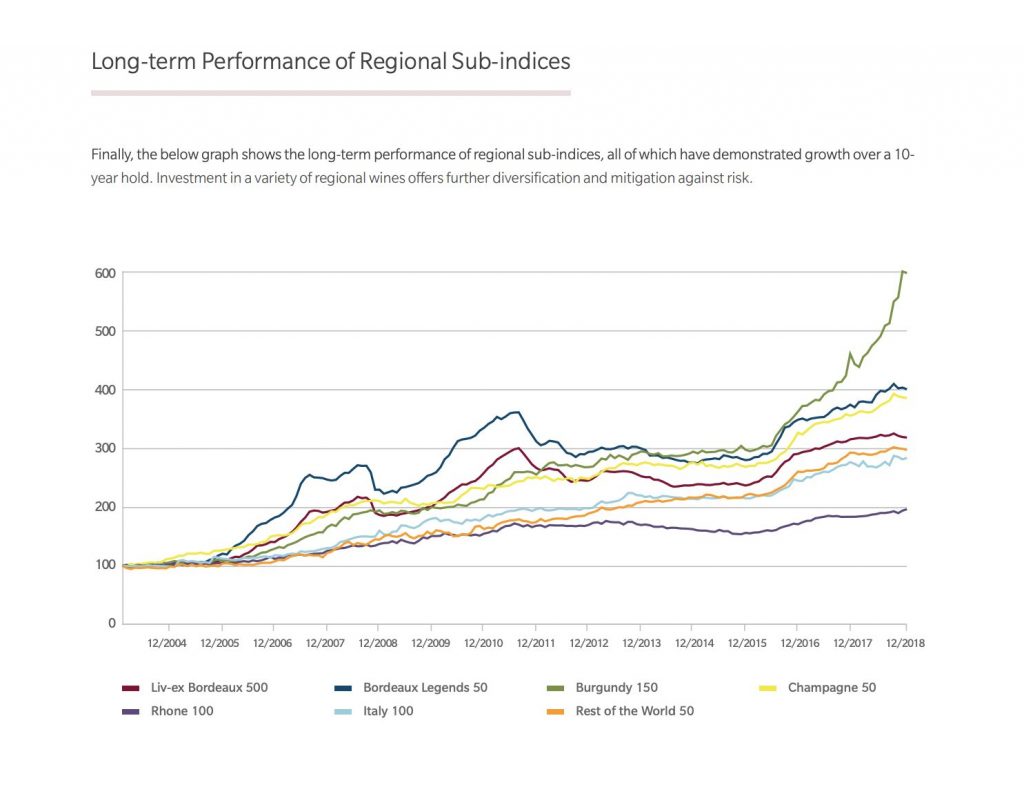
Investment-grade wines can come from regions all over the world, but those that can be deemed ‘fine wine’ are subject to strict controls. Regulations vary from country to country, but are generally enshrined in law, with some classifications dating back more than 100 years. It’s no surprise; given its illustrious winemaking history that France is home to the largest proportion of investment grade wines. The adjacent graphic demonstrates the current geographical split of investment grade wines by region.
What is Liv-ex?
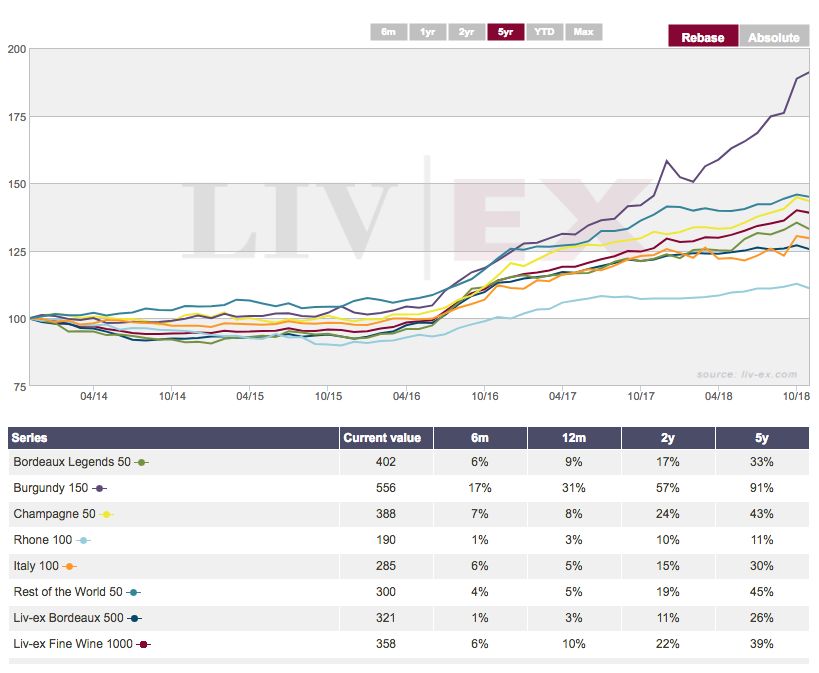
Liv-ex, also known as the London International Vintners Exchange, is the best-known wine trading platform in the world, providing real-time and historic data and 35,000 price updates daily. It’s the wine investment industry’s leading reference point, channelling more than £28 million worth of bids and offers every day. The exchange has over 400 global members. Liv-ex is known within the industry to provide the most reliable pricing data for valuation purposes.
Information below is taken from:
https://www.wineinvestment.com/wine-investment/market-performance/
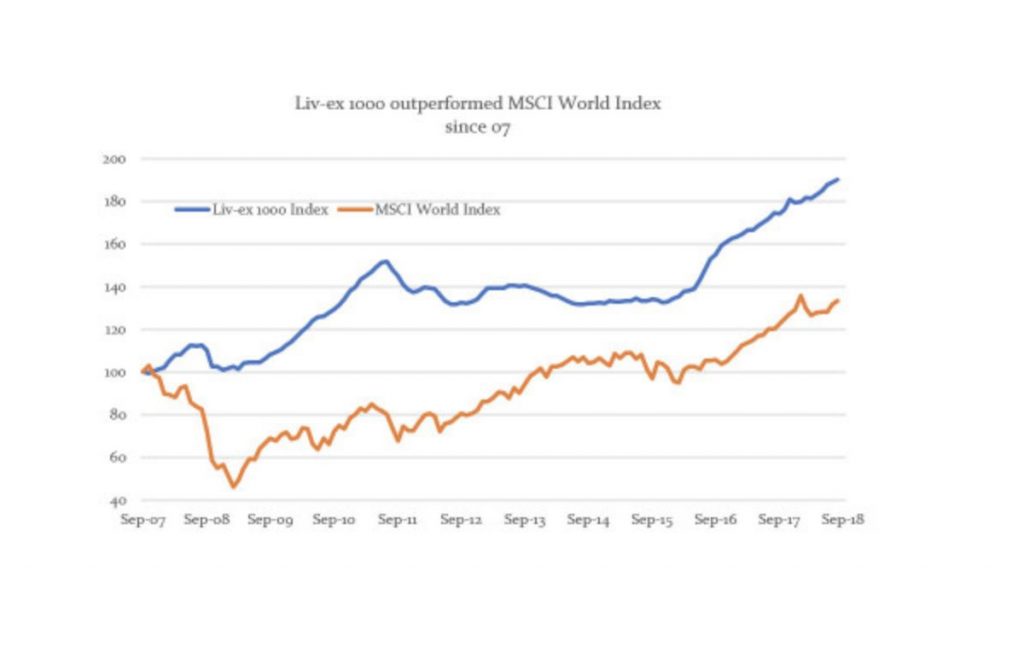
Outperformance of FWI versus World Equities
The most convincing factor of the viability of fine wine investment to provide absolute returns to investors is that wine has produced positive absolute returns in every return single-5 year holding period since the first period in record (dec-09 to dec-14) except until the last two data points.
The forward 5-year return of Liv-ex 1000 follows a U-shape, with the highest forward rate of return at the end of 2008 and 2013 and the lowest return during the period of 2010 – 2011. As expected, the fine wine market has consistently delivered a positive absolute return over any 5-year return. More importantly, of the total 57 Five-Year periods that we covered (2008-2018), only 9 periods experienced negative returns.
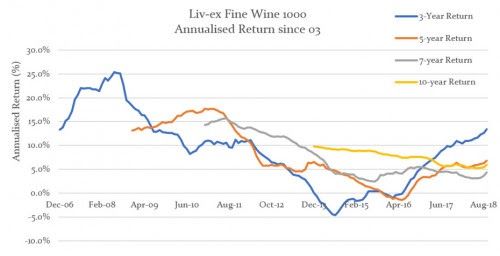
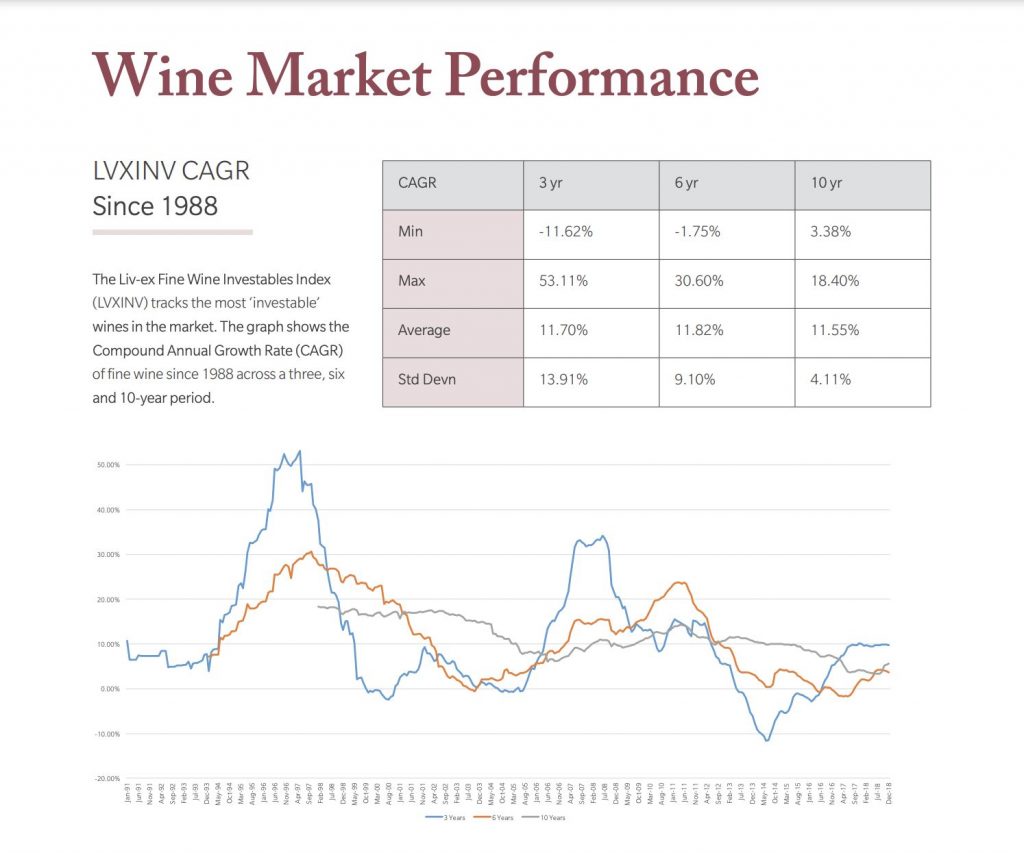
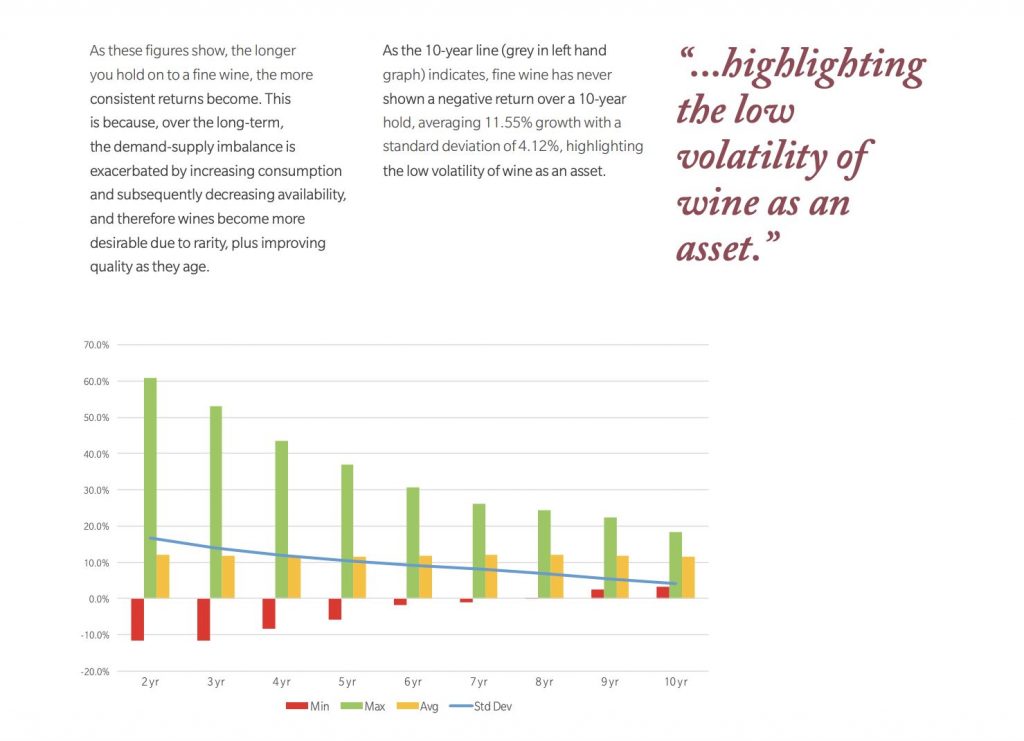
As the table and graph demonstrate, fine wine returns become more consistent and less volatile the longer it is held. This occurs as a result of the fundamental principles that drive fine wine prices – a demand/supply imbalance. Fine wine has a perfectly inverse supply curve which is exacerbated over time as the available wine is consumed and diminished.
https://jftwines.com/wine-resources/fine-wine-investment/fine-wine-market-history-performance/
Supporting articles:
**
This section includes information derived from articles and publications from leading economists and financial minds in order to provide insight and clarity regarding economic historical context, current market dynamics and forecasting future trends.
Marc Faber is a world-famous investor, publisher of the Gloom Boom & Doom Report newsletter and the director of Marc Faber Ltd, which acts as an investment advisor and fund manager.
Stephen Roach, Ph.D., is a Senior Fellow at Yale University’s Jackson Institute of Global Affairs and a Senior
Lecturer at Yale’s School of Management. He was formerly Chairman of Morgan Stanley Asia and the
firm’s Chief Economist for the bulk of his 30-year career at Morgan Stanley (https://www.uscc.gov/sites/default/files/Roach_Bio.pdf).
They state that “eventually, the value WILL come down relative to other currencies, and things WILL shift…over time. How long that takes is anyone’s guess. Hedge your bets. You’d be smart to keep at least some money in harder assets with limited supply.”
“I expect something similar to Bretton Woods to happen again, be the dollar pinned to Gold or Bitcoin or something. The deficits and money printing isn’t serving the American people. It’s serving the dollar backstop of the global economy. Global elites are getting ready and using the (corona)virus as an excuse to introduce a new reserve currency based on a basket of currencies and hopefully some gold too. “What currency would you buy and hold for the next 50 years?” Absolutely none. At 2% yearly inflation, your holding would be worth 63% less after 50 years. The US Dollar is programmed to devalue at 2% a year. In fact, the economy could not survive without that induced devaluation. One hundred ten years of data from Macrotrends indicates silver appreciates at 4.3% per annum with the volatility that creates income opportunities for selling covered calls.”
“The dollar being the world’s reserve currency, allows the USA to run trillion-dollar deficits because it exports its inflation to the world, and the world absorbs it as the increasing population needs more reserve currency to conduct its business every year. Under FIAT money, money was debt, so debt was wealth. People forgot that an IOU is nothing until it’s paid-back. We now have a world drowning in “wealth” that is nothing but IOU’s that depends on all other IOU’s performing, when mathematically we long ago passed the point where this was true. All that “wealth” is an illusion. Goods availability is likely to crater in the next couple years, and if politicians attempt to make people whole by creating trillions in credit, all it will do is crush the average man’s standard of living even more.”
Interview w/Stephen Roach (impending crash of US Dollar)
**
Ray Dalio is an American billionaire hedge fund manager and philanthropist. He started Bridgewater Associates out of his two-bedroom apartment in New York in 1975 and under his leadership, the firm has grown into the fifth most important private company in the US according to Fortune Magazine.
The enclosed information is taken from Ray Dalio’s book: The Changing of World Order – Why Nations Succeed and Fail. It is a particularly long piece, but it is worth reading as it discusses the relationship between assets and money, particularly in times of debt crises.
– Intro
It is also the case that all reserve currencies in the past have ceased to be reserve currencies, often coming to traumatic ends for the countries that enjoyed this special privilege.
Chapter 2 – Appendix – The Changing Value of Money
Printing and Devaluing Money Is the Easiest Way out of a Debt Crisis
While people tend to think that a currency is pretty much a permanent thing and believe that “cash” is the safe asset to hold, that’s not true because all currencies devalue or die and when they do cash and bonds (which are promises to receive currency) are devalued or wiped out. That is because printing a lot of currency and devaluing debt is the most expedient way of reducing or wiping out debt burdens.
All Currencies Have Been Devalued or Died
Think about holding currencies (which is the same as holding cash) in the same way as you would think about holding any other assets. How would you have done in these investments?
Of the roughly 750 currencies that have existed since 1700, only about 20% remain, and of those that remain all have been devalued.
In 1850 the world’s major currencies wouldn’t look anything like the ones today. While the dollar, pound, and Swiss franc existed back then, most others were different and have since died. In 1850 in what is now Germany, you would have used the gulden or the thaler. There was no yen, so in Japan you might have used a koban or the ryo instead. In Italy you would have used one or more of the six possible currencies. You would have used different currencies in Spain, China, and most other countries. Some were completely wiped out (in most cases they were in countries that had hyperinflation and/or lost wars and had large war debts) and replaced by entirely new currencies. Some were merged into currencies that replaced them (e.g., the individual European currencies were merged into the euro). And some remain in existence but were devalued, like the British pound and the US dollar.
What Do They Devalue Against?
The most important thing for currencies to devalue against is debt. That is because the goal of printing money is to reduce debt burdens. Debt is a promise to deliver money, so giving more money to those who need it lessens the debt burden. How this newly created money and credit then flow determines what happens next. Increases in the supply of money and credit both reduce the value of money and credit (which hurts holders of it) and relieve debt burdens.
At times when the central bank is faced with the choice of a) allowing real interest rates (i.e., the rate of interest minus the rate of inflation) to rise to the detriment of the economy or b) preventing real interest rates from rising by printing money and buying those cash and debt assets, they will choose the second path, which reinforces the bad returns of holding “cash” and those debt assets.
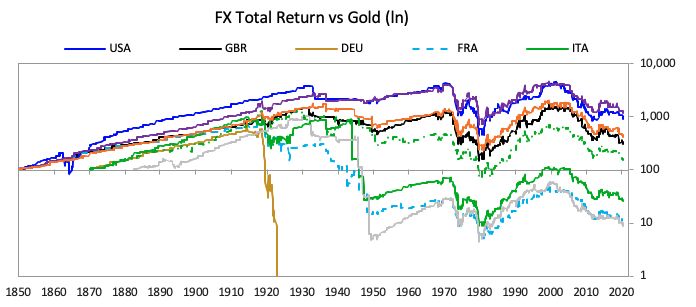
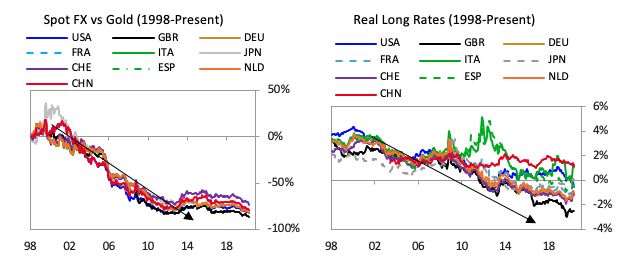
The chart below shows spot currency returns of the three major reserve currencies in relation to gold since 1600. While we will examine these in depth in this study, for now I would like to focus your attention on both the spot currency returns and the total returns of holding interest-earning cash in all the major currencies since 1850.
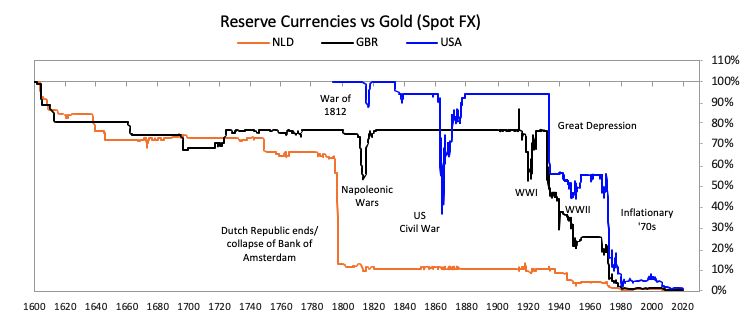
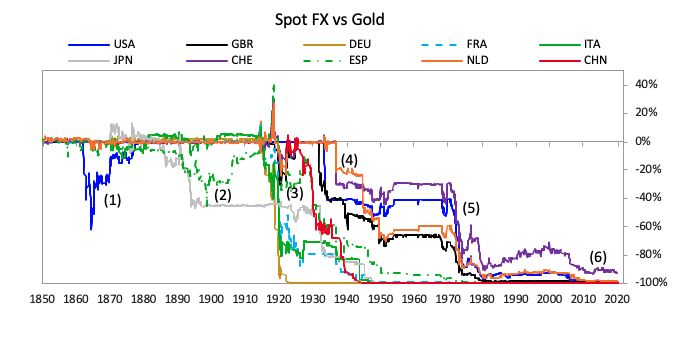
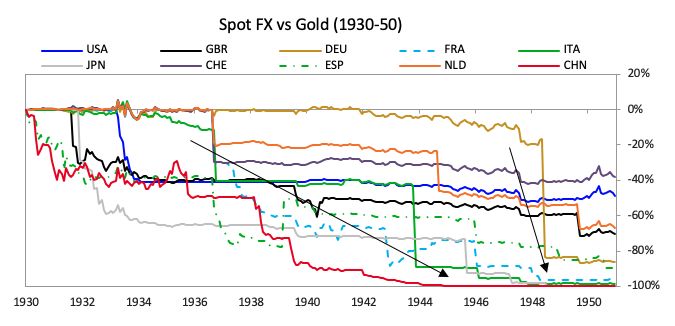
As shown in the next two charts, devaluations typically occur as relatively abrupt declines during debt crises that are separated by periods of currency stability during periods of prosperity.
Here are some notable takeaways:
- Since 2000 the value of money has fallen in relation to the value of gold due to lots of money and credit creation and because of interest rates being low in relation to inflation rates. Because the monetary system has been a free-floating monetary system there have not been the abrupt breaks that there have been in the past; there has been a more gradual and continuous devaluation in which low or in some cases negative interest rates did not provide compensation for the increasing amount of money and credit and the resulting (albeit low) inflation.
By the mid-1950s, before that devaluation, the dollar and the Swiss franc were the only currencies worth even half of their 1850s value.
Since 2000 we have seen a more gradual and orderly loss of total return in currencies when measured in gold, consistent with the broad fall in real rates across countries during those decades.
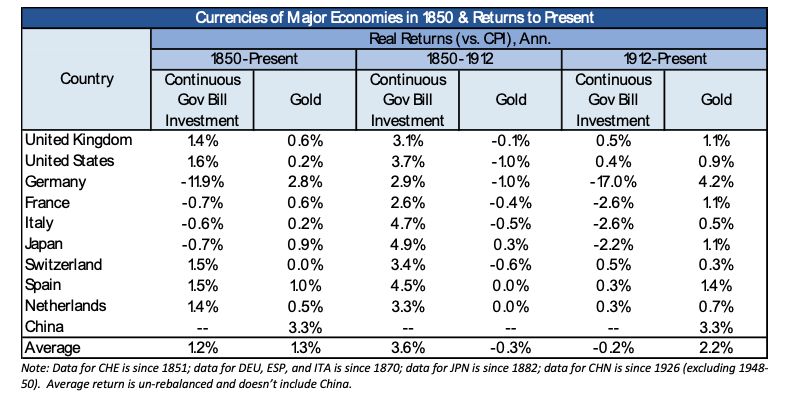
In summary the basic picture is that:
- The average annual return of holding interest-earning cash currency since 1850 was 1.2%, which was a bit lower than the average real return of holding gold, which was 1.3%, though there were huge differences in their returns at various periods of time and in various countries.
- In about half of the countries since 1850 you would have received a positive real return for holding bills, in half a negative real return, and in cases like Germany you would have been totally wiped out twice.
- Most of the real return from holding interest-earning cash currency came in the periods when most countries were on gold standards that they adhered to because they were in prosperous periods (e.g., in the Second Industrial Revolution and in the post-1945 boom when debt levels and debt-service burdens were relatively low and income growth was nearly equal to debt growth) until near the end of that long cycle.
- The real (i.e., inflation-adjusted) return for bills since 1912 (the modern fiat era) has been -0.2%. The real return of gold during this era has been 2.2%. During this period you would only have made a positive real return holding interest-earning cash currency in about half of the countries, and you would have lost meaningfully in the rest (losing over 2% a year in France, Italy, and Japan, and losing over 15% a year in Germany due to the hyperinflation).
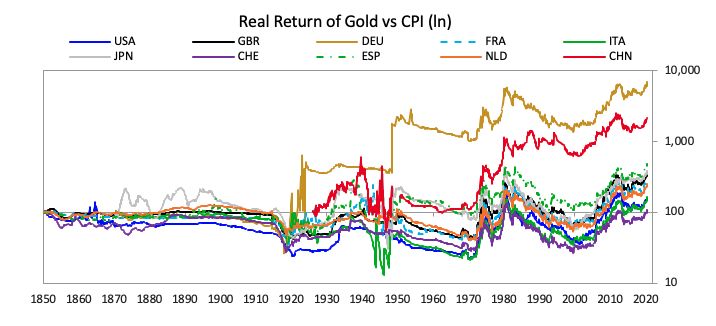
The next chart shows the real returns of holding gold throughout the period from 1850 to the present. As shown, from 1850 until 1971 gold returned (through its appreciation) an amount that equaled the amount of money lost to inflation, with the exception of Germany, though there were big variations around that average such as those previously described (e.g., until the 1930s currency devaluations and the end of World War II devaluations of money that were part of the formation of the Bretton Woods monetary system in 1944). Gold stayed steady in price while money and credit expanded until 1971. Then in 1971 currencies were devalued and delinked from gold so there was a shift from a Type 2 monetary system (e.g., notes backed by gold) to a fiat monetary system.
That delinking of currencies from gold and going to a fiat monetary system gave central banks the unconstrained ability to create money and credit. In turn that led to high inflation and low real interest rates that led to the big appreciation in the real gold price until 1980-81 when interest rates were raised significantly above the inflation rate, which led currencies to strengthen and gold to fall until 2000. That is when central banks pushed interest rates down relative to inflation rates and, when they couldn’t push them any lower by normal means, printed money and bought financial assets, which was supportive to gold prices.
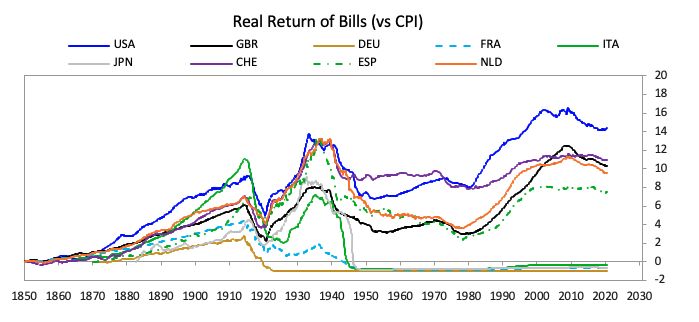
The Value of Currencies in Relation to Goods and Services
In about half of the currencies interest-rate-earning cash provided a return that was above the rate of inflation, in the other half it provided bad real returns, and in all cases, there were big and roughly 10-year-long swings around these averages. In other words, history has shown that there are very large risks in holding interest-earning cash currency as a storehold of wealth especially late in debt cycles.
Ray Dalio – The Changing World Order – Chapter 2 – Money, Credit, Debt and Economic Activity
Since one person’s spending is another person’s income, that cutting of expenses will hurt not just the entity that is having to cut those expenses but it will hurt the ones who depend on that spending to earn income. Similarly, since one’s debts are another’s
assets, that defaulting on debts reduces other entities’ assets, which requires them to cut their spending.
That is because having a reserve currency allows the country to borrow a lot more than it could otherwise borrow which leads it to have too much debt that can’t be paid back which requires its central bank to create a lot of money and credit which devalues the currency so nobody wants to hold the reserve currency as a storehold of wealth.
What is money?
Money is a medium of exchange that can also be used as a storehold of wealth.
By medium of exchange, I mean that it can be given to someone to buy things.
1) most money and credit (especially the fiat money that now exists) has no intrinsic value,
2) it is just journal entries in an accounting system that can easily be changed,
3) the purpose of that system is to help to allocate resources efficiently so that productivity can grow, rewarding both lenders and borrowers, and
4) that system periodically breaks down.
As a result, since the beginning of time, all currencies have either been destroyed or devalued.
Throughout history central governments and central banks have created money and credit which weakened their own currencies and raised their levels of monetary inflation to offset the deflation that comes from the deflationary credit and economic contractions.
There is an old saying that “gold is the only financial asset that isn’t someone else’s liability.” That is because it has widely accepted intrinsic value, unlike debt assets or other assets that require an enforceable contract or a law to ensure the other side will deliver on its promise to deliver whatever it promised to deliver (which when it’s just “paper” currency that can easily be printed isn’t much of a promise). When countries were at war and there was not trust in the intentions or abilities to pay, they could still pay in gold. So gold (and to a lesser extent silver) could be used as both a safe medium of exchange and a safe storehold of wealth.
It is important to understand the difference between money and debt. Money is what settles claims—i.e., one pays one’s bills and one is done. Debt is a promise to deliver money.
When governments print a lot of money and buy a lot of debt so the amounts of both money and debt increase, they cheapen money and debt, which essentially taxes those who own it to make it easier for debtors and borrowers. When this happens enough that the holders of this money and debt assets realize what is happening, they seek to sell their debt assets and/or borrow money to get into debt that they can pay back with cheap money. They also often move their wealth to other storeholds of wealth like gold, certain types of stocks, and/or somewhere else (like another country that is not having these problems). At such times central banks have typically continued to print money and buy debt directly or indirectly (e.g., by having banks do the buying for them) and have outlawed the flow of money into inflation-hedge assets and alternative currencies and alternative places.
Then Comes the Flight Back into Hard Money
When taken too far, the over-printing of fiat currency leads to the selling of debt assets and the earlier-described bank “run” dynamic, which ultimately reduces the value of money and credit, which prompts people to flee out of both the currency and the debt (e.g., bonds). They need to decide what alternative storehold of wealth they will use. History teaches us that they typically turn to gold, other currencies, assets in other countries not having these problems, and stocks that retain their real value.
Typically at this stage in the debt cycle there is also economic stress caused by large wealth and values gaps, which lead to higher taxes and fighting between the rich and the poor, which also makes those with wealth want to move to hard assets and other currencies and other countries. Naturally those who are governing the countries that are suffering from this flight from their debt, their currency, and their country want to stop it. So, at such times, governments make it harder to invest in assets like gold (e.g., via outlawing gold transactions and ownership), foreign currencies (via eliminating the ability to transact in them), and foreign countries (via establishing foreign exchange controls to prevent the money from leaving the country). Eventually the debt is largely wiped out, usually by making the money to pay it back plentiful and cheap, which devalues both the money and the debt.
To review, in the long-term debt cycle, holding debt as an asset that provides interest is typically rewarding early in the cycle when there isn’t a lot of debt outstanding, but holding debt late in the cycle when there is a lot of it outstanding and it is closer to being defaulted on or devalued is risky relative to the interest rate being given. So, holding debt (e.g., bonds) is a bit like holding a ticking time bomb that rewards you while it’s still ticking and blows you up when it goes off.
Ray Dalio – The Changing World Order – Chapter 4 – The Big Cycle of the United States and the Dollar, Part 2
The ability to print money and have it accepted by the world, which is an ability that only a major world reserve currency country (especially the United States) has, is the most valuable economic power a country can have. At the same time, a country that does not have sizable reserves (which is the position the US is in) is highly vulnerable to not having enough “world money.” That means that the US is now very powerful because it can print the world’s money and would be very vulnerable if it lost its reserve currency status.
As has been the case with the Dutch guilder and the British pound, the status of the US dollar has significantly lagged and is significantly greater than other measures of its power. That means that if the US dollar were to lose its reserve status and significantly depreciate in value it would have a devastating effect on the finances of those countries holding those reserves as well as private-sector holders of dollar-debt assets. Who would be the winners? Those with dollar-debt liabilities and those with non-dollar assets would be the big winners. In the concluding chapter, “The Future,” we will explore what such a shift might look like.
**